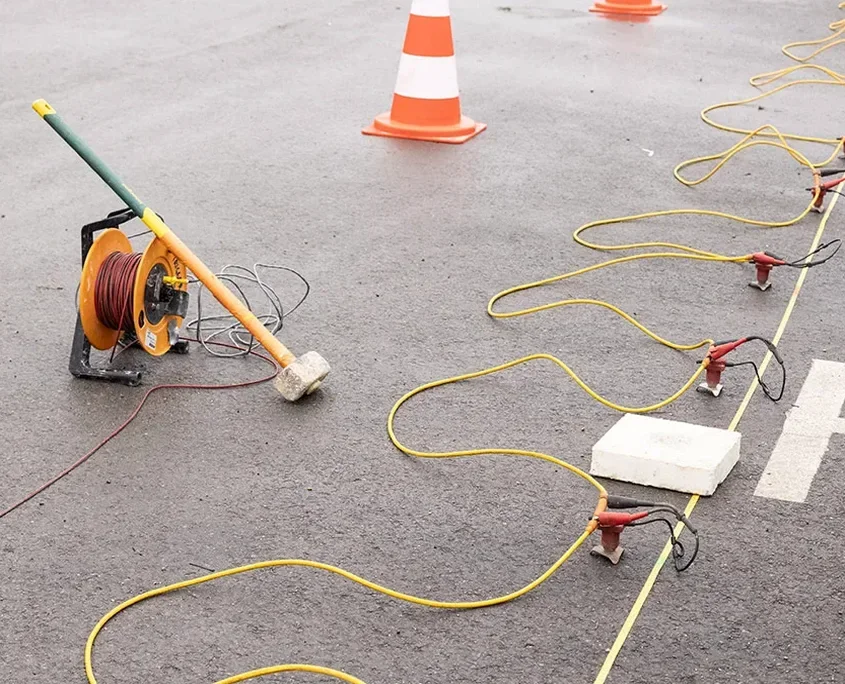
The first thing people notice when our field crew sets up near Warrington is the line of geophones laid out across the pavement or a grassed brownfield site, connected to a battery-powered seismograph that sits on the tailgate of the truck. That yellow box records microsecond arrivals from a sledgehammer or weight-drop source, building a velocity model of the ground beneath the River Mersey’s floodplain and the Sherwood Sandstone bedrock that underlies much of the borough. We run seismic tomography surveys across post-industrial land, transport corridors, and proposed foundation footprints where the drift thickness changes over short distances. Because Warrington sits at the junction of the Mersey and Manchester Ship Canal, the near-surface geology mixes alluvium, glacial till, and weathered sandstone, which makes seismic velocity contrasts sharp and highly informative for engineering design. A well-parameterised refraction or reflection profile gives us more than depth to rock — it maps lateral stiffness changes that boreholes alone can miss, especially on sites where the MASW survey already flagged a low-velocity anomaly that needs tighter resolution before a piling layout is finalised.
A refraction line across Warrington’s drift-covered sandstone can resolve rockhead within half a metre, which often reduces the number of boreholes needed for foundation design.
Site-specific factors
We worked on a site off Winwick Road where the initial desk study showed Sherwood Sandstone at four metres based on historical boreholes, yet the first refraction line returned a rockhead depression dropping below twelve metres along the northern boundary — a buried channel filled with soft, organic silts that the original investigation had completely missed. Had the design team relied solely on sparse point data, the piled foundation would have been under-length across half the footprint, and differential settlement would have appeared within the first year of operation. Warrington has dozens of similar paleochannels cutting through the sandstone, particularly near the Mersey’s historic meander belt and under former industrial yards where the natural ground was reworked during canal construction. Missing a low-velocity fill or a peat lens in the drift sequence can shift the fundamental period of a structure into a range that amplifies ground motion, even on a moderate seismic event. The tomography data feeds directly into the ground model, so the structural engineer sees the velocity layering, the shear-wave profile if we run a parallel MASW line, and a defensible rockhead contour that satisfies the requirements of Eurocode 7 for an adequate investigation depth.
Common questions
How much does a seismic tomography survey cost for a typical Warrington site?
For a single refraction profile of 115–235 metres with 48 geophones and an accelerated weight drop source, the cost in Warrington typically falls between £1,960 and £4,350 depending on site access, line preparation, and whether we need traffic management. A combined refraction-plus-MASW package tends toward the upper end of that range. Every quote is mapped to the specific spread geometry and target depth, so the figure you receive will reflect your actual ground conditions — not a generic rate card.
What depth can seismic refraction reach in the Sherwood Sandstone around Warrington?
Depth penetration depends on spread length and source energy, not on the rock type alone. With a 115-metre spread and a weight drop, we routinely image 30–40 metres below ground level in competent sandstone. Stretching the spread to 230 metres and using a heavier source can push that past 60 metres, which is usually enough to reach the top of the Manchester Marls in the deeper parts of the Mersey Basin.
Can seismic tomography detect voids or old mine workings under Warrington?
Yes, but with caveats. A void in sandstone appears as a low-velocity anomaly on a refraction tomogram, and reflection profiling can pick up a cavity roof if the impedance contrast is strong enough. In Warrington, where salt extraction and marl mining have left legacy workings, we often recommend a complementary resistivity survey to cross-check anomalies that seismic data alone cannot fully resolve.
How long does a seismic survey take on a typical Warrington development?
For a single 24- or 48-channel refraction line, field acquisition usually takes half a day including setup and breakdown. Processing and tomographic inversion add two to three working days before the draft report is ready. Larger campaigns with multiple lines or combined refraction-reflection surveys may run three to five days on site, depending on the number of spreads and the need for traffic control.
Do you need to close roads or footpaths to run a seismic line in Warrington?
Not always. We can acquire data inside a site boundary without affecting public rights of way, and on quiet residential streets we often work with stop-and-go traffic management rather than a full closure. If the line must cross a busy road like the A49 or the A57, we coordinate with Warrington Borough Council’s highways team and include the traffic management plan in the method statement before mobilising.