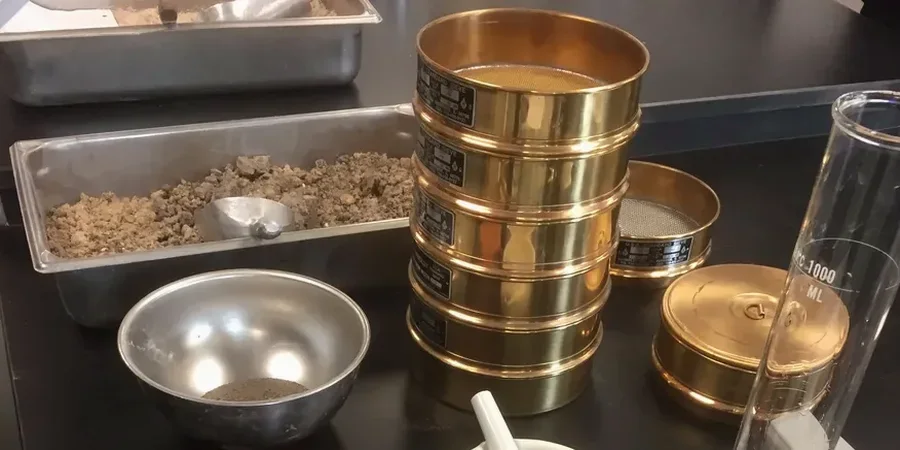
The biggest mistake we see on Warrington sites is the blind assumption that glacial till is uniformly graded. It is not. Layers of laminated clay, silt lenses, and pockets of sand are common across the Mersey basin. A single point classification from a hand specimen is not enough. Our sieve and hydrometer analysis gives the full particle size distribution from 75 mm down to 2 microns. That matters when you are designing drainage blankets for the A49 corridor or checking frost susceptibility under a slab in Birchwood. Without it, you are guessing at permeability and compaction behaviour. We run the full suite in our soil lab — wet sieve, dry sieve, and sedimentation — all referenced to BS 5930. For deeper strata characterisation, we often pair this with SPT drilling to get undisturbed samples from the underlying Sherwood Sandstone or Mercia Mudstone, where particle size shifts dramatically with depth.
A particle size curve is not just a classification exercise — it is the first signal of drainage, frost, and compaction problems in Warrington's glacial soils.
Site-specific factors
Warrington sits at roughly 8 m AOD, with groundwater levels that fluctuate seasonally across the Mersey floodplain. A particle size curve that shows a gap in the fine sand range — say between 0.1 mm and 0.5 mm — is a red flag for internal erosion. If you are placing a granular filter around a drainage pipe in that soil, you need a filter gradation that bridges the gap. The Terzaghi filter criteria are unforgiving. Get it wrong, and the fine fraction washes out. The pipe clogs. The pavement heaves. We have seen this failure mode twice in the past five years on industrial estates south of the river. Both times, the original ground investigation skipped the full hydrometer analysis. The cost to retrofit drainage was four times the lab fee. For sites within the Environment Agency flood zones, the particle size distribution is also a required input for seepage and consolidation modelling. Do not omit it.
Common questions
What is the standard turnaround for a sieve and hydrometer test from a Warrington site?
Standard turnaround is 3-4 working days from sample receipt. We can deliver a rapid sieve (coarse fraction only) in 24 hours if the material is predominantly granular. The hydrometer sedimentation phase takes the most time — approximately 24 hours of controlled readings at 20 °C in a constant-temperature bath.
How much sample do you need for the full particle size distribution?
For fine-grained soils (silts and clays typical of Warrington's alluvial deposits), 500 g of material passing the 2 mm sieve is sufficient. For mixed soils with gravel content, we need up to 25 kg to run the full coarse sieve stack. We collect samples directly from your site or accept delivered samples in sealed bags with chain-of-custody documentation.
What does a grain size analysis cost in the Warrington area?
A combined sieve and hydrometer test typically ranges from £90 to £170 per sample, depending on the number of samples in the batch and whether you need the rapid or full sedimentation protocol. We provide a fixed-price quote before testing begins, with no hidden fees for the lab report.
Which particle size parameters do you report, and how are they used?
We report D10, D30, D60, and the coefficients of uniformity (Cu) and curvature (Cc). We also report the percentage by mass of gravel, sand, silt, and clay. These parameters feed directly into filter design (Terzaghi criteria), permeability estimation (Hazen formula), frost susceptibility classification, and compaction specification checks under BS 5930 and Eurocode 7.